TOOTH EXTRACTIONS IN THE NORTH-EAST OF ENGLAND DUE TO TOOTH DECAY
Children aged 5-9
Are there more or less in fluoridated areas? The official line is that fluoridated areas see less tooth extractions.
The tooth extraction data produced by the Office for Health Improvement and Disparities (OHID), a department within the DHSC, has not been analysed by OHID.
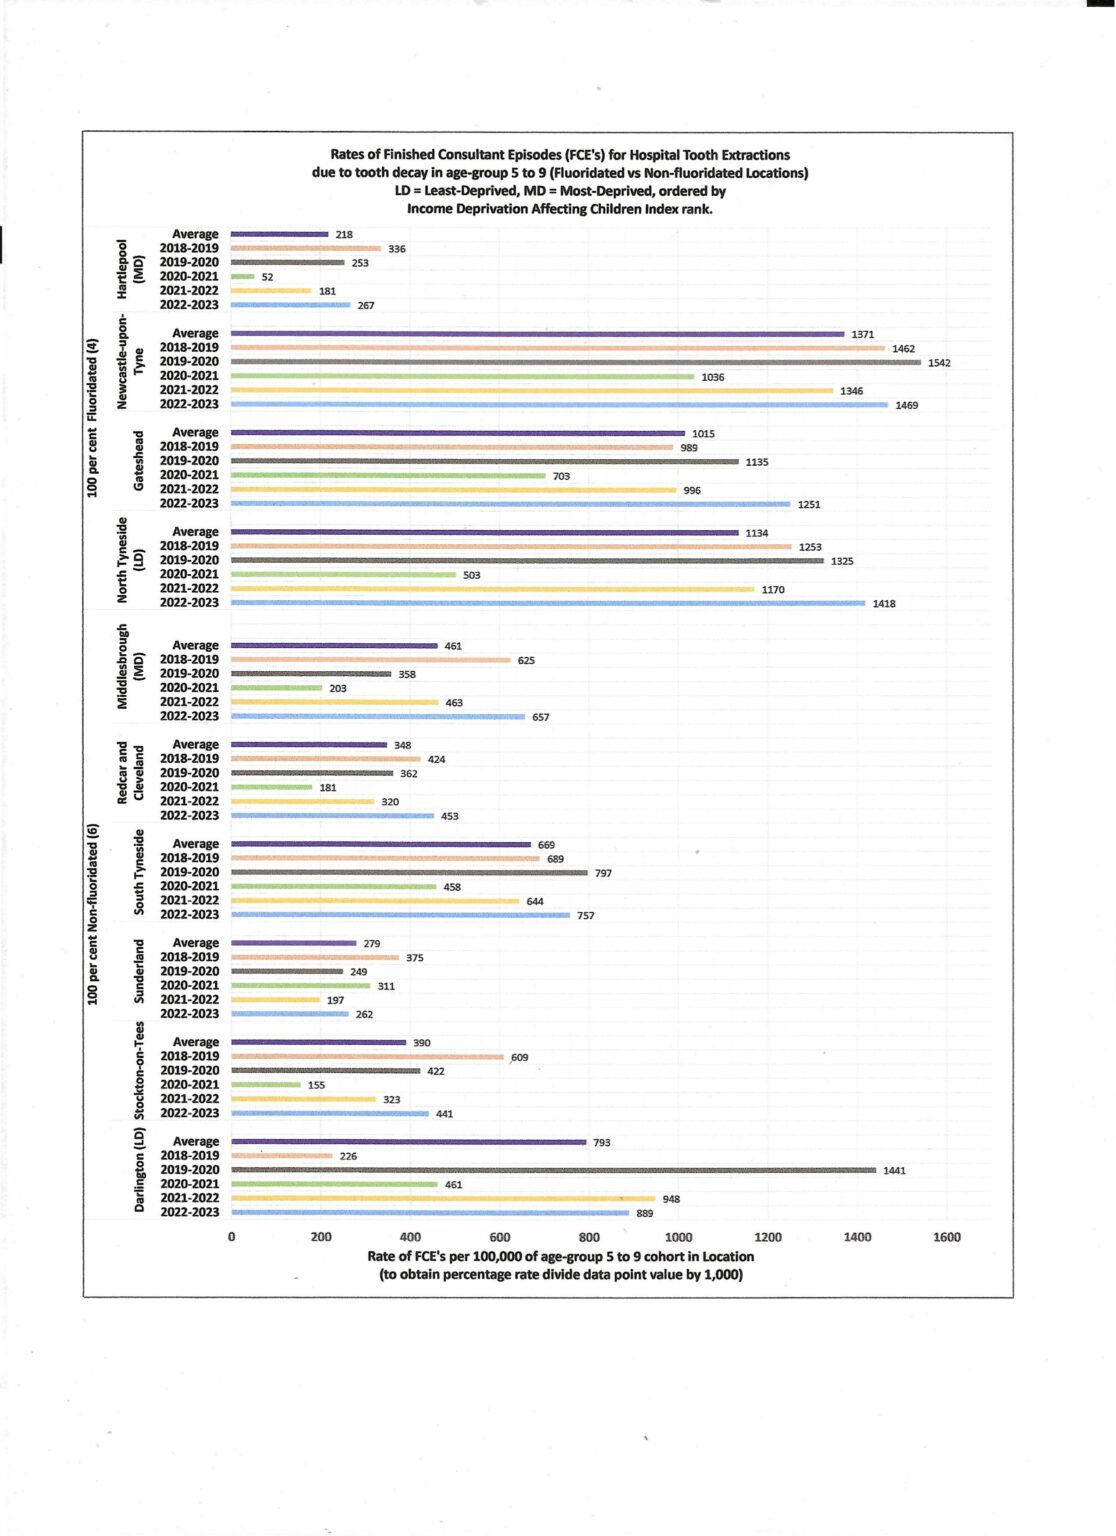
We have, therefore, done the job for them and have produced a really beautiful bar chart (See below) which shows the rate of extractions per 100,000 pop.
The results, illustrated by the length of the bars, show that 100% fluoridated areas of the North-East experience MORE extractions due to dental decay than the 100% non-fluoridated areas of the North-East.
This will come as a disappointment to the NHS which is depending on swallowed fluoride to reduce dental decay! After all, if you are all fluoridated, the NHS hopes to reduce the cost of hospital extractions. That now seems to be a forlorn hope.
The three fully fluoridated areas are North Tyneside, Newcastle and Gateshead
The six non-fluoridated areas are South Tyneside, Sunderland, Darlington, Middlesbrough, Stockton-on-Tees, Redcar and Cleveland.
We could not use data for County Durham and Northumberland because they are partially fluoridated.
We have to ignore comparing the data for Hartlepool because although it has natural fluoride, it’s magnesium fluoride, and magnesium is particularly good for tooth health.
North East Region
Rates of Finished Consultant Episodes (FCE’s) for Hospital Tooth Extractions due to tooth decay in age-group 5 to 9 (Note – In its ’Water fluoridation Health Monitoring Report 2022’ (page 51) the Office for Health Improvement and Disparities informs that the age-group 5 to 9 is the most vulnerable for tooth extractions –
hence the other groups need no analysis)
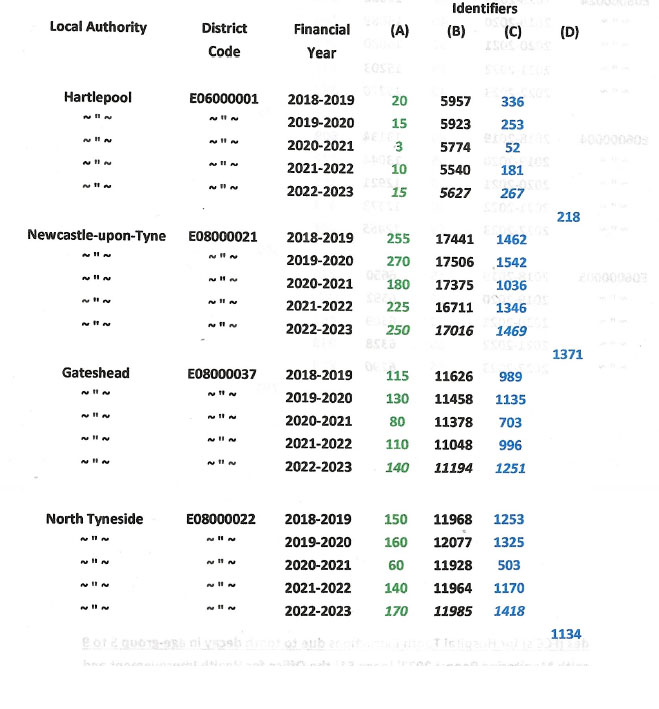
The numbers in green are the FCE count for age-group 5 to 9 years, and are located in Column E in the ’machine-readable’ Excel spreadsheet contained in this OHID file, published 8th February 2024: – https://www.gov.uk/government/statistics/hospital-tooth-extractions-in-0-to-19-year-olds-2023
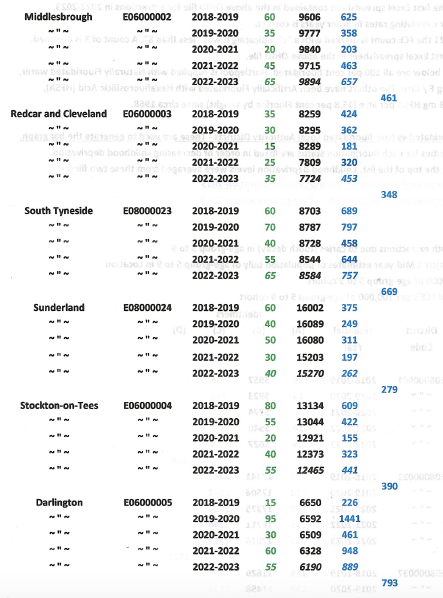
The numbers in blue are ratios (i.e., the Rate) of FCE’s for extractions due to tooth decay in the age-group 5 to 9 cohort. Numbers in italics are in the first Excel spreadsheet contained in the above OHID file for extractions in 2022-2023, confirming the method for calculating rates in other years is correct.
For Hartlepool in 2020-2021 the FCE count is marked with a “c” indicating it was “less than 8”. A count of 3 is assumed. See Notes section in the first Excel spreadsheet in the above OHID file.
The four Local Authorities below are all 100 per cent fluoridated. Hartlepool is supplied with Naturally Fluoridated water, at a fluoride level of 1.2 mg F / litre. The others have been Artificially Fluoridated with Hexafluorosilicic Acid (HFSA), to a target dose-rate of 6.3 mg HFSA per litre (15.8 per cent Fluorine by weight) since circa 1968.
Comparison Table for Fluoridated vs Non-fluoridated Local Authority Districts – These are used to generate the bar graph. Note that the Local Authorities for each fluoridation status are listed in order of decreasing childhood deprivation,
with the most-deprived at the top of the list. Childhood deprivation levels were averaged from these two files:
https://www.gov.uk/government/statistics/english-indices-of-deprivation-2015 https://www.gov.uk/government/statistics/english-indices-of-deprivation-2019
Identifier meanings
(A) – Count of FCE’s for tooth extractions due to caries (tooth decay) in age-group 5 to 9
(B) – Office of National Statistics Mid-year estimates of population tally of age-group 5 to 9 in Location
(C) – Rate of FCE’s per 100,000 of age-group S to 9 cohort
(D) – 5-year-average rate of FCE’s per 100,000 of age-group 5 to 9 cohort
The six Local Authorities below are considered to be 100 per cent Non-fluoridated, and funding has been secured to fluoridate them.
Northumbrian Water Ltd informs that some parts of Sunderland have water with Natural Fluoride at levels between
0.3 mg F / litre and 0.5 mg F / litre. However, since November 2017 Durham County Council has included Sunderland in its plan for fluoridation expansion, indicating that its fluoride level is inadequate, hence its inclusion below.