
Water Fluoridation is the Most Expensive Intervention for the Prevention of Dental Decay
OHID/DHSC (PHE) Return of investment – a flawed model
The case for Water Fluoridation (WF) being the least expensive effective way of reducing dental decay has been built on quicksand.
The infographic which was doing the rounds in 2016-2020 and which was used by pro-fluoridation Public Health England (PHE) Oral Health Consultants to convince Local Authority (LAs) Health and Wellbeing Scrutiny Boards that WF is highly effective and the least troublesome intervention for LAs to adopt, is erroneous.
City and County Councillors were unlikely to be able to detect the sleight of hand and it was left to colleagues in FFAUK to point out the distorted manipulations. Below is the infographic:

Below is a short paper which explains the cost implications in greater detail.
——————-
The Higher Cost of WF Compared to Individualised Oral Health Interventions and PHE’s Return on Investment (RoI) Calculations
by Dave Forrest, C.Eng.
The “Return on Investment” tool employed by PHE to financially compare different oral health interventions is a good example of “smoke and mirrors”. This section goes into detail but initially, it’s vital to explain that “all that glisters is not gold” and we regret to say that the financial case constructed by PHE for WF being the best financial option to prevent dental decay in disadvantaged small children is heavily flawed. The text below explains the situation in relation to the WF proposal for the North-East of England between 2015-2020
Background
Public Health England (PHE) has produced a document “Return on Investment of Oral Health Interventions” which is described as a “decision-support tool to support Local Authorities investment decisions regarding their local commissioning of oral health improvement programmes for pre-school children”. Accompanying this document is an infographic which shows relative cost/benefits for the five interventions, the most attractive of which appears to be that for water fluoridation – £1 spent gives a “benefit” of £12.71 after 5 years. So attractive does this seem, it is worthwhile looking at it in more detail.
Approach
This is not a forensic examination of the so-called “tool”; it refrains from delving into the jargon of ROI (Return on Investment), discounted savings, net present value, etc. and is kept as simple as possible to help with understanding the underlying principles and data.
Costs
The headline from the PHE infographic (and also appearing in the local newspapers) effectively says “Spend £1 and get £12.71 of savings”. If I had £1 to invest, it would look an attractive proposition. It would be equivalent to a compound rate of interest of almost 65%. For comparison, if I invested my £1 in an ISA at say 5%, after 5 years my £1 would only be worth £1.28.
It all looks too good to be true – so is there a catch?
The PHE “tool” can be populated with data by any local authority who may want to use it in helping with their decision making. However, PHE has populated it with data to get the “Spend £1 and get £12.71 of savings”. PHE has used a cost figure of 50 pence per head of population to get the £1 figure – the common denominator across all 5 interventions.
Using data obtained by UKFFFA after successive Freedom of Information requests relating to the annual costs of WF and fluoridated population data from the British Fluoridation Society website, it is possible to see where this figure comes from:
Total spend on water fluoridation 2018 – 2019 (UKFFFA website) = £2,995,309
Number of people supplied with artificially fluoridated water (BFS website) = 5,797,000
Dividing these two numbers (£2,995,309 by 5,797,000) gives £0.52 per head of population for England so not far from the figure used by PHE.
However, we have actual figures for fluoridated Northumberland as an example:
Total spend on water fluoridation 2018 – 2019 (UKFFFA website) = £166,523.79
Number of people supplied with artificially fluoridated water (BFS website) = 101,000
Dividing these two numbers (£166,523.79 by 101,000) gives £1.65 per head of population for Northumberland – so this is already 3 times higher than the assumption used by PHE.
Looking a little bit further, most of this population (101,000) don’t ‘need’ water fluoridation and probably may not want it. It is only the 0-5-year-old children who are being targeted for this “treatment”. Using UK census data, the age cohort of 0-5 years is only about 5% of the population, so re-doing the calculation where the annual revenue cost (£166,523.79) is spread over 5% of the 101,000 population (5,050) the cost per head (of those receiving the “treatment”) is a massive £33 per child per annum.
What is disturbing is that the PHE “tool” uses costs per head of the 5-year-old population for 4 of the “oral health improvement programmes” illustrated in the infographic, but not for the 5th programme (WF). Thus, it’s a case of comparing 4 apples with 1 pear which consequently provides a false financial conclusion. It is unclear why PHE has used a different baseline for water fluoridation.
£33 already dwarfs the so-called “benefits” of £12.71.
But it gets worse! Strictly speaking, the capital costs for the proposed scheme should also be included to get a true cost picture. The capital costs for a proposed fluoridation scheme across County Durham, Sunderland and South Tyneside are £4.125 million. (Durham County Council, 2016).
Since these initial costs (£4.125 million) are being borne by PHE they have been omitted from the “tool”. However, it matters not who picks up the final tab for initial capital equipment costs.
The money is being spent on the scheme and capital costs must be included in the Return on Investment calculation.
Another notable omission is the “Capital Equipment Replacement Costs”. Over the 20-year life of a water fluoridation scheme some of the equipment used to add and control the fluoride will wear out and need replacing. A recommendation is that mechanical and instrumentation equipment be replaced every 5 years and electrical and control equipment every 15 years.
It may be argued by PHE that that organisation will also bear these Capital Replacement Costs but there is evidence gleaned from FoI request replies that where they have done this in the past (e.g. Cornhow and Ennerdale in Cumbria and in Nottinghamshire) they have progressively recovered these costs at the same time as recovering annual revenue costs.
Taking a simplified and optimistic view, let us assume that the equipment only needs replacing once in its 20-year life:
Capital Replacement Costs = £4.125 million ÷ 20 = £206,250 per year
Again, this figure would need to be divided by the number of children who are being targeted for this “treatment”. Using data from Durham County Council (2016):
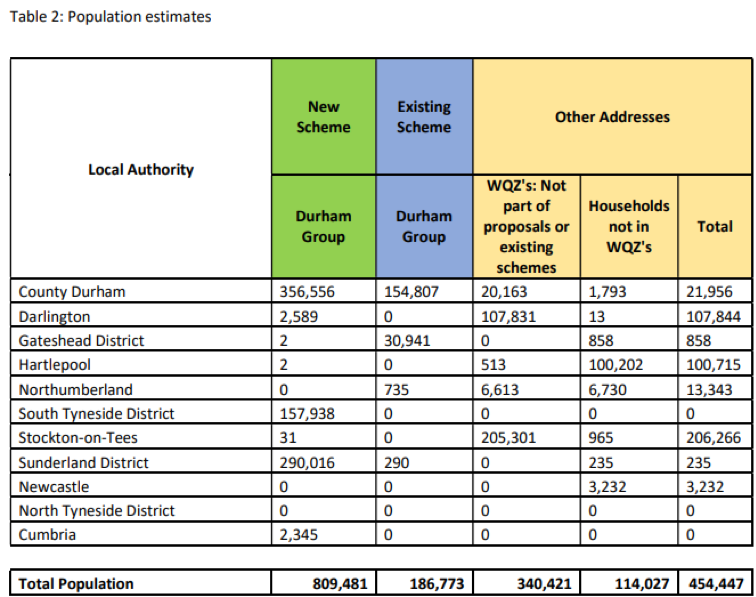
Total additional population for the WF programme in the North East = 809,481
But only 5% of these (40,474) are children under 5 years of age
So, the additional annual cost per child is £206,250 ÷ 40,474 = £5.10.
The following table was produced by Durham County Council and related to the extra population which could be impacted by WF in the North-East of England prior to the Pandemic. (Post-Pandemic, more boroughs and areas have been added to the WF plans and 1.6 million people are now threatened)
In total, the local authority would have to spend £33 + £5.10 which is £38.10 per child per year for water fluoridation which is 73 times more than the 52p assumed in Option 3 in the PHE “tool”.
Decision makers may want to question if this represents good value for money or if other oral health interventions would be more cost beneficial. (Note that we do not have access to the Capital Replacement Costs for the currently fluoridated areas of Derwentside and Gateshead District.)
The above calculations do NOT include the initial Capital costs which, when factored into our RoI calculation of £38.10 per child per annum makes WF financially unaffordable.
————–
We’ve copied the infographic below.
Having read the text above, the reader’s attention is drawn to the difference between the PHE calculation of £12.71 set against £38.10.
“What is disturbing is that the PHE “tool” uses costs per head of the 5-year-old population for 4 of the “oral health improvement programmes” illustrated in the infographic, but not for the 5th programme (WF). Thus, it’s a case of comparing 4 apples with 1 pear which consequently provides a false financial conclusion. It is unclear why PHE has used a different baseline for water fluoridation. “
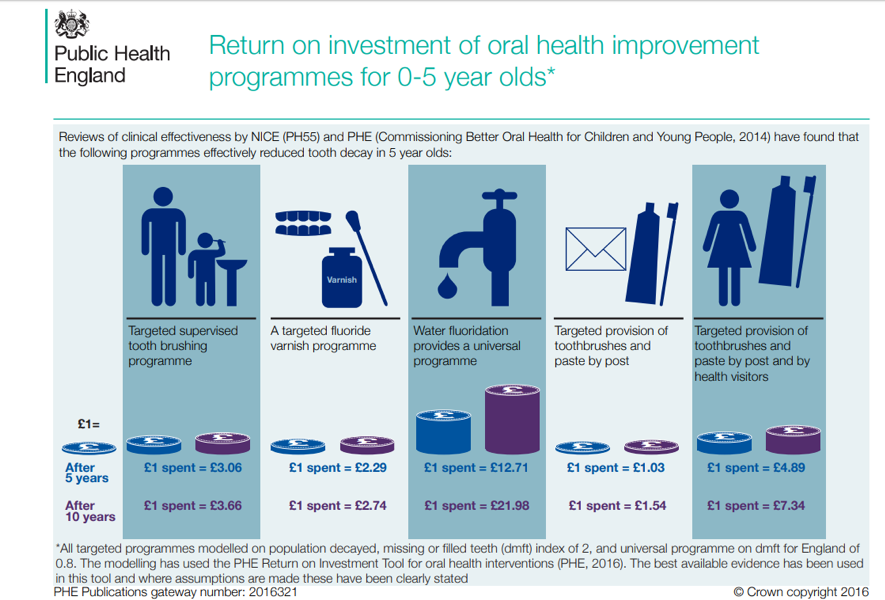
Unwary City and County Councillors will not have analysed the infographic and would have taken it at face value. Delve deeper and the clue to the deception lies in the phrase “Water fluoridation provides a universal programme”. The word “targeted” is missing from the column headed with a tap.
The other 4 interventions are targeted meaning that they do not affect an entire population.
Thus, 4 apples and 1 pear. Is it too much to hope that this particular RoI calculation will go pear-shaped, eventually become universally discredited and be consigned to the dustbin of history along with Water Fluoridation.
2nd edition 8th March 2023